[Seurat] Single cell 분석
먼저, Seurat과 관련된 library 설치 ( Seurat 설치 에러는 아래 글 참고)https://doraemin.tistory.com/36 [Seurat] 설치 ( + R 버전 에러)Seurat 패키지 설치하기Seurat 공식 사이트의 'install' 부분의 코드 작성# Enter comm
doraemin.tistory.com
[Seurat] [MAST] DEGs Analysis
#############MAST, limma, Deseq2# D26과 D54 세포에 대한 정확한 조건 설정seurat_object$stage 1.5, ]head(degs_filtered)# 필터링된 DEG 개수 확인nrow(degs_filtered)
doraemin.tistory.com
[Seurat] [limma] DEGs Analysis
[Seurat] [limma] DEGs Analysis
# limma :# First, limma 분석을 위한 raw counts 데이터 추출counts_data 1.5인 DEG 필터링degs_limma_filtered 1.5, ]nrow(degs_limma_filtered) # 필터링된 DEG 개수 확인head(degs_limma_filtered) # 필터링된 상위 DEGs 확인
doraemin.tistory.com
[Seurat] [DESeq2] DEGs Analysis
[Seurat] [DESeq2] DEGs Analysis
# Deseq2 :# Convert the Seurat object to a DESeq2 dataset# 필요한 패키지 로드if (!requireNamespace("DESeq2", quietly = TRUE)) { install.packages("DESeq2")}library(DESeq2)# Seurat 객체에서 count 데이터 추출 (유전자 x 세포)# 데이터
doraemin.tistory.com
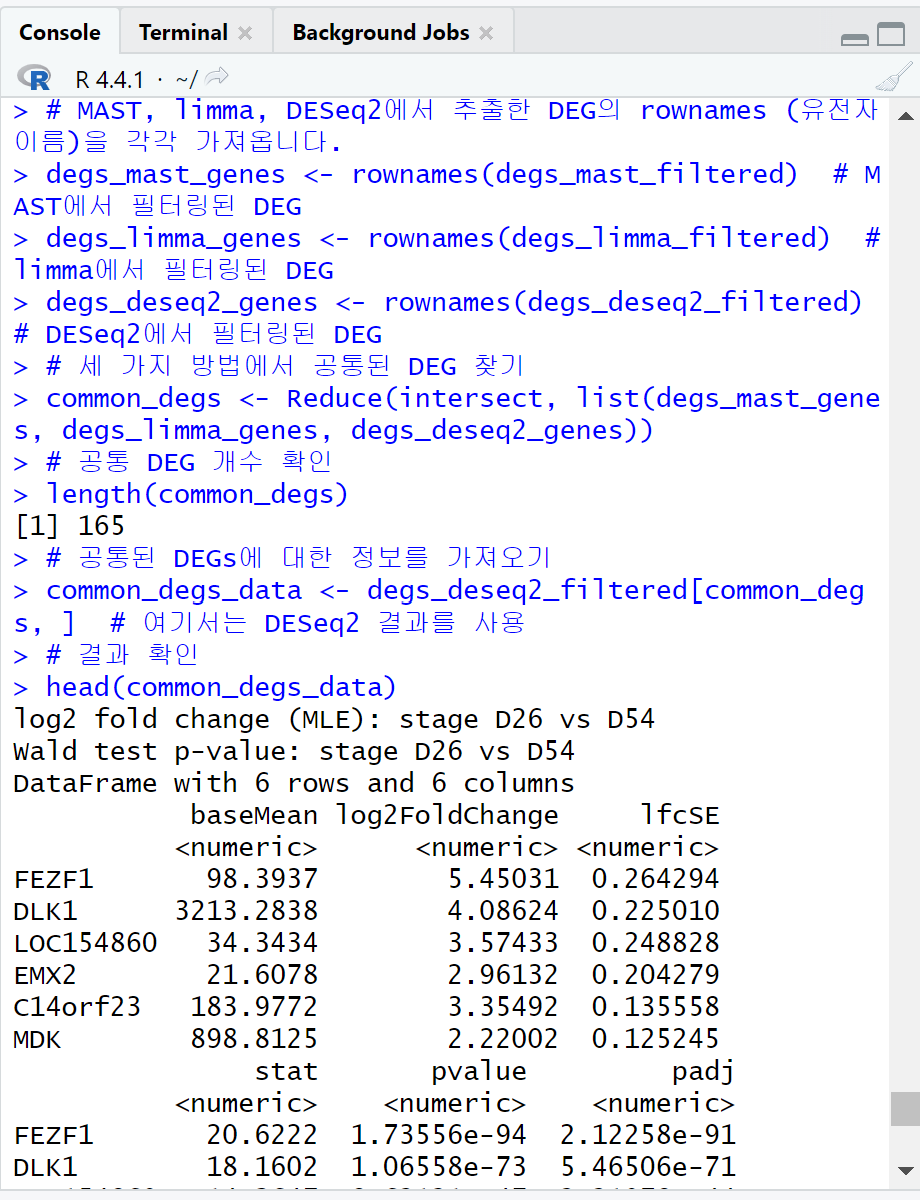
# MAST, limma, DESeq2에서 추출한 DEG의 rownames (유전자 이름)을 각각 가져옵니다.
degs_mast_genes <- rownames(degs_mast_filtered) # MAST에서 필터링된 DEG
degs_limma_genes <- rownames(degs_limma_filtered) # limma에서 필터링된 DEG
degs_deseq2_genes <- rownames(degs_deseq2_filtered) # DESeq2에서 필터링된 DEG
# 세 가지 방법에서 공통된 DEG 찾기
common_degs <- Reduce(intersect, list(degs_mast_genes, degs_limma_genes, degs_deseq2_genes))
# 공통 DEG 개수 확인
length(common_degs)
# 공통된 DEGs에 대한 정보를 가져오기
common_degs_data <- degs_deseq2_filtered[common_degs, ] # 여기서는 DESeq2 결과를 사용
# 결과 확인
head(common_degs_data)
# 필요한 패키지 로드
library(ggplot2)
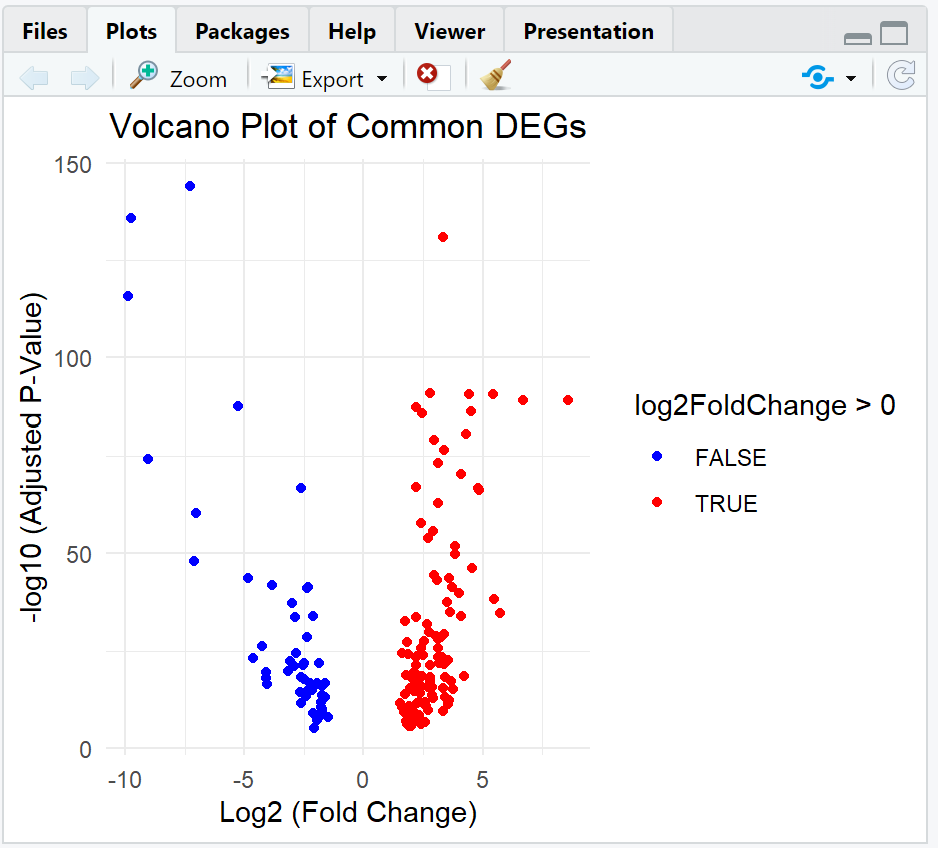
# Volcano plot 그리기
ggplot(common_degs_data, aes(x = log2FoldChange, y = -log10(padj))) +
geom_point(aes(color = log2FoldChange > 0), size = 1.5) +
scale_color_manual(values = c("blue", "red")) + # 다운레귤레이션(blue), 업레귤레이션(red)
theme_minimal() +
labs(title = "Volcano Plot of Common DEGs",
x = "Log2 (Fold Change)",
y = "-log10 (Adjusted P-Value)") +
theme(plot.title = element_text(hjust = 0.5))
# 업레귤레이션된 유전자
up_regulated <- sum(common_degs_data$log2FoldChange > 0)
# 다운레귤레이션된 유전자
down_regulated <- sum(common_degs_data$log2FoldChange < 0)
cat("Up-regulated genes:", up_regulated, "\n")
cat("Down-regulated genes:", down_regulated, "\n")

# 필요한 패키지 설치 및 로드
if (!requireNamespace("pheatmap", quietly = TRUE)) {
install.packages("pheatmap")
}
library(pheatmap)
# 공통된 DEGs에 대한 발현 데이터 추출 (D26과 D54 세포만)
expression_data <- counts_data[common_degs, ] # 공통 DEGs의 발현 데이터
# Seurat 객체에서 D26과 D54 세포의 메타데이터(stage 정보)만 추출
stage_data <- seurat_object$stage
# D26과 D54 시점의 세포들만 필터링
d26_d54_cells <- which(stage_data %in% c("D26", "D54"))
expression_data <- expression_data[, d26_d54_cells]
# Z-score 정규화: 유전자별로 표준화를 수행하여 비교할 수 있도록 함
expression_data <- t(scale(t(expression_data)))
# stage 정보를 다시 저장
cell_stage <- stage_data[d26_d54_cells]
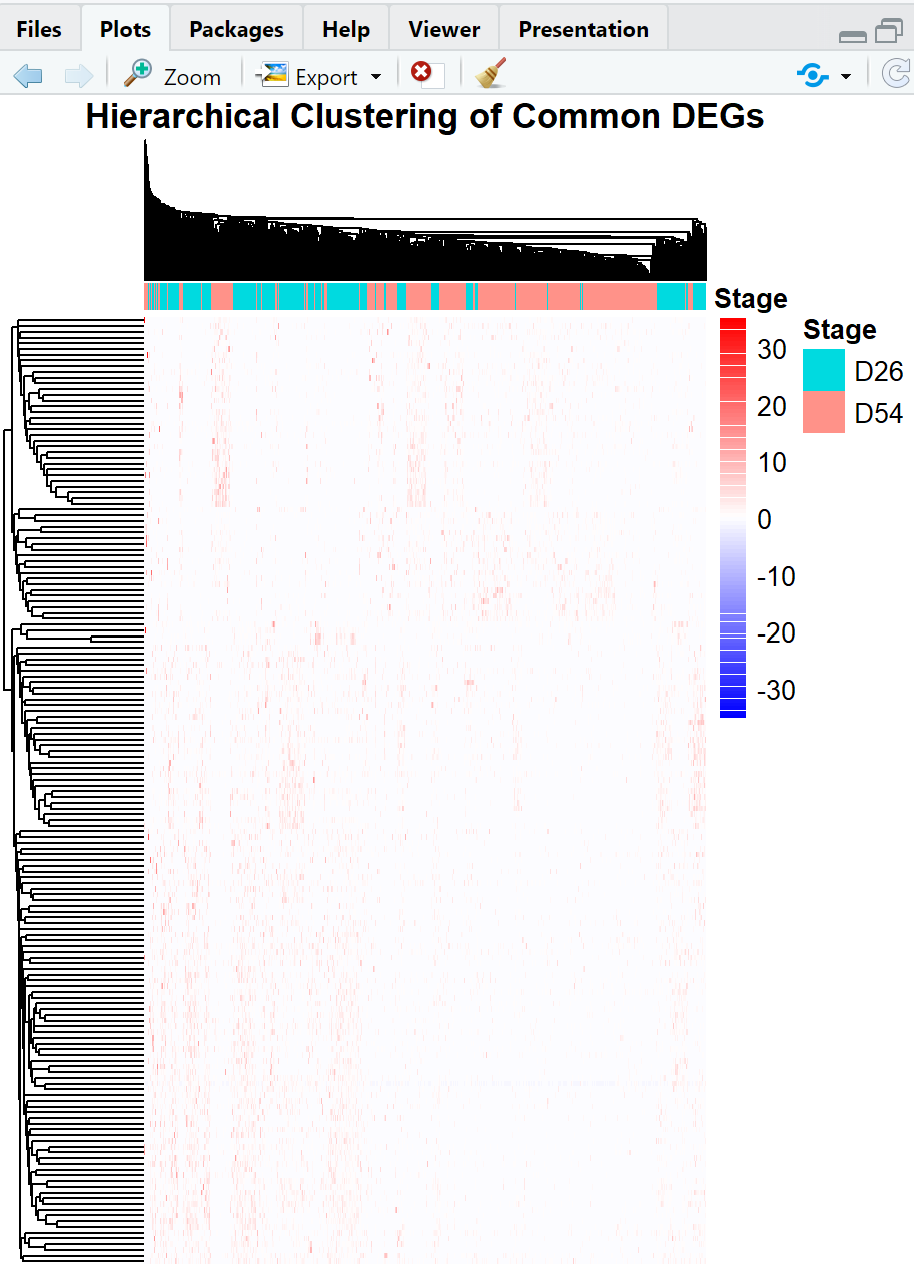
# 히트맵의 색상 팔레트 조정
pheatmap(expression_data,
annotation_col = data.frame(Stage = cell_stage), # D26과 D54 시점 표시
clustering_method = "ward.D2",
scale = "row",
color = colorRampPalette(c("blue", "white", "red"))(100), # 색상 팔레트 설정
show_rownames = FALSE,
show_colnames = FALSE,
main = "Hierarchical Clustering of Common DEGs")
# 클러스터링 방법을 변경해 시도 (예: complete linkage)
pheatmap(expression_data,
annotation_col = data.frame(Stage = cell_stage),
clustering_method = "complete", # 다른 클러스터링 방법 시도
scale = "row",
color = colorRampPalette(c("blue", "white", "red"))(100),
show_rownames = FALSE,
show_colnames = FALSE,
main = "Hierarchical Clustering of Common DEGs")
# 클러스터링 방법을 변경해 시도 (예: average)
pheatmap(expression_data,
annotation_col = data.frame(Stage = cell_stage),
clustering_method = "average", # 다른 클러스터링 방법 시도
scale = "row",
color = colorRampPalette(c("blue", "white", "red"))(100),
show_rownames = FALSE,
show_colnames = FALSE,
main = "Hierarchical Clustering of Common DEGs")


GSE86982 Analysis Summary
GSE86982 smartseq TPMSingle-cell RNA-seq data analysis reveals functionally relevant biomarkers of early brain development and their regulatory footprints in human embryonic stem cells (hESCs)https://academic.oup.com/bib/article/25/3/bbae230/7670713DATA AV
doraemin.tistory.com
'AI & Data Analysis > Coding & Programming' 카테고리의 다른 글
| [CNN] [전이학습] 시작 및 실행 (2) | 2025.01.17 |
|---|---|
| [scRNA] Preprocessing and Analysis (1) | 2024.12.14 |
| [Seurat] [DESeq2] DEGs Analysis (0) | 2024.09.19 |
| [Seurat] [limma] DEGs Analysis (0) | 2024.09.19 |
| [Seurat] [MAST] DEGs Analysis (0) | 2024.09.19 |


